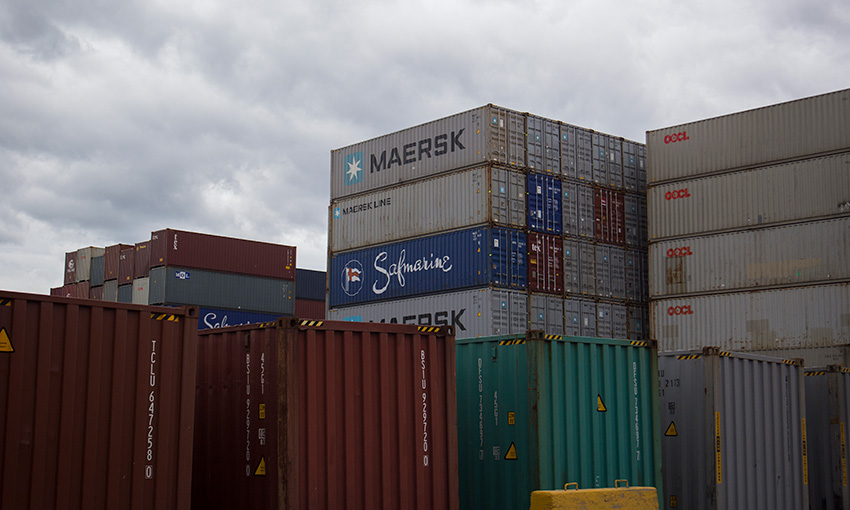
THE LATEST Container Port Performance Index (CPPI) for calendar year 2023, which is developed by the World Bank and S&P Global Market intelligence, was published last week. The development of the CPPI is based on total container ship in port time. The calculation of the ranking of the index employs two different methodological approaches: an administrative or technical approach, which is a pragmatic methodology reflecting expert knowledge and judgment; and a statistical approach, using factor analysis and then a rank aggregation method applied that combines the results from the two different approaches and returns, one aggregate ranking.
The results were disappointing for most Australian ports, as they were ranked within the lowest quartile. Bell Bay, the top Australian performer was ranked 215 amongst the 400 ranked ports in the world. It’s not clear why Bell Bay is ranked in the index as it is not representative of major container ports in Australia (FY22/23 throughput 17,838 TEU). Melbourne was the best performing capital city port at a ranking of 313, down 37 spots on last year. Our friends across the Tasman didn’t do much better, with Auckland and Tauranga also in the 300 to 400 range.
The five capital city container ports all dropped in performance compared to last year’s CPPI. This was no surprise as during calendar year 2023 all ports were affected by industrial action by tug operators and stevedores, more so than in any other year.
I have written extensively and in more detail in the DCN on previous CPPI reports and argued that, solely relying on waterside performance and not incorporating landside performance and other factors (like comparing gateway ports with transhipment ports), does not paint an accurate picture of port performance. This is acknowledged by the report’s authors in the following statement: “In the future, the CPPI is expected to undergo further refinement in subsequent editions, incorporating stakeholder feedback, advancements in data scope and quality, and additional trend analysis. The World Bank-S&P Global Market Intelligence team will continue to improve the methodologies, expand the scope by potentially including more ports, and enhance the data. The next version, CPPI 2024, will be comparable to the current edition, facilitating trend analysis of container port performance across the aggregate index.”
Here are some examples of why I believe the index does not truly reflect port rankings. The port of Tanjung Priok’s (Jakarta)ranking went up from 281 in 2022 to 25 in 2023. Beirut’s ranking jumped 242 places from 323 to 81. The well-established Port of Hamburg jumped 201 places from 325 to 124. The Port of Halifax, which by some industry observers is held up to be comparable with Australian ports went from 46th place in 2021 to 276 in 2022 and back up to 113 in this year’s ranking! Not sure what happened there.
So, you would have to ask, how realistic is the 2023 league table? In my view, the CPPI needs further refinement to be truly representative of the world’s container port performance. Martin Humphreys, lead transport economist at the World Bank, said container shipping continues to be an “unpredictable and volatile” sector. The same could be said about the CPPI. It will be interesting to see if the authors of the Australian Competition and Consumer Commission Container Stevedore Monitoring Report 2022-2023 will refer to the CPPI, as they have done in previous years.